What Happened To The Energy Markets During The ‘Bomb Cyclone’?
"While the wholesale energy markets performed well, higher than usual energy usage as a result of colder than expected temperatures during January's 'Northeast Winter Bomb Cyclone' may represent higher than anticipated utility bills through March billing cycles."
Timing Was Everything
- Several northeastern cities broke temperature records in 2018 during the ‘Bomb Cyclone’ event
- New Englanders consumed almost 1 million more megawatts of electricity compared to last year
- Electricity customers can help stabilize their electric bills by watching their consumption during extreme weather events and securing a long-term electric-supply plan
It is now well into February of 2018 and the holiday season already seems like a lifetime ago. Even the most dedicated holiday decorators call it quits after mid-January.
Even so, most of us experience a holiday ripple-effect that bleeds into the New Year, reminding us that having the attitude of we’ll cross that bridge when we get there, can have it’s unattended consequences.
Hartford, Connecticut saw record-breaking cold right out of the gate in 2018 along with many other northeast cities with what the media dubbed the ‘Bomb Cyclone’ event that occurred between Jan. 2nd and Jan. 7th 2018; an event that resulted in a media-frenzy featuring floating ice blocks, coastal flooding, and painful wind chills.
This historic event happened directly after the holiday season which was completely unexpected for most. A time when energy consumption across the northeast is always expected to be higher than the rest of the year.
The environmental impacts of the storm were covered at length by the media outlets but the financial impact to residents wasn’t felt for several weeks after the storm, in the form of their electric utility bills.
While the wholesale energy markets performed relatively well, higher energy usage as a result of the extremely cold temperatures during January’s ‘Northeast Winter Bomb Cyclone’ may result in higher electricity bills through March billing cycles.
Simply put, higher consumption=much higher electric bills, particularly for those in the path of this year’s storm.
Just How Much More Energy Did New England Residents Use During This Period?
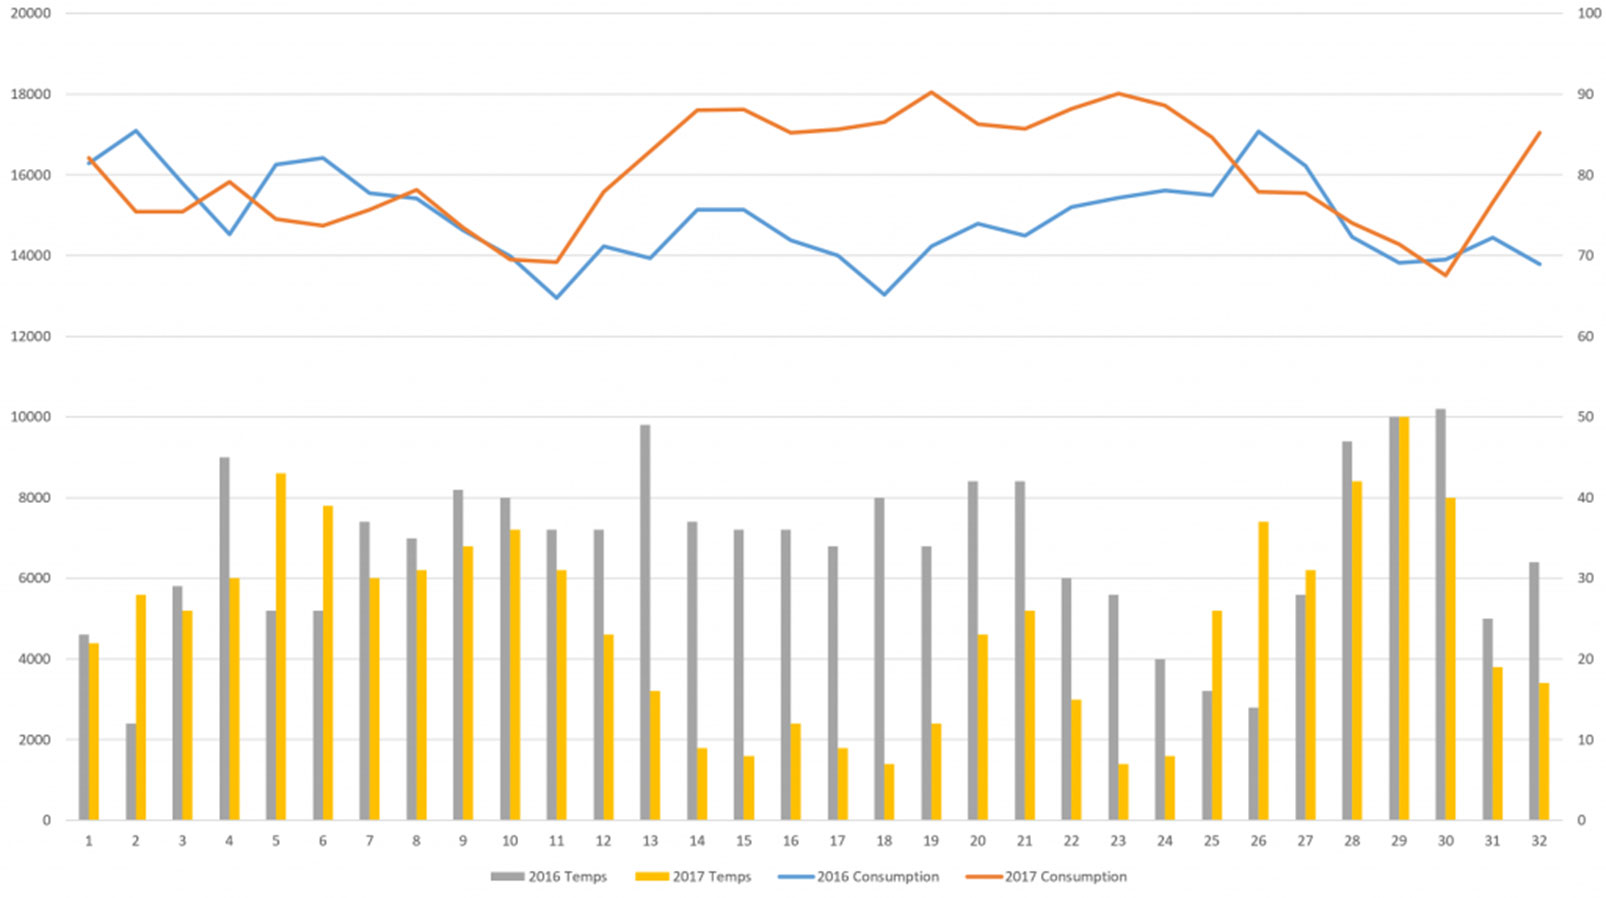
Residents Energy analysts pulled New England’s collective energy consumption from December 15th through January 15th for both 2016 and 2017.
The New England territories traditionally see a “spike” in consumption over this period however, when comparing last winter to this winter, with the addition of a historic storm, there is no surprise as to why some residents are seeing dramatic increases in their electric bills.
The daily average hourly consumption last year, in the New England territories, was 14,926 MW (megawatts) from December 15th through January 15th. The daily average hourly consumption for this winter, over the same time period, was 16,028 MW. Meaning, over a 32 day period, New England residents used approx. 846,336 MW morethan they did for the same period last winter.

The above chart shows the daily average hourly electricity consumption for New England. Last winter (blue line) and this winter (orange line) and the average daily temps, last year (gray bar) and this year (yellow bar) for Boston, MA. As temperatures begin to fall, the orange line (consumption) begins to rise.
What This Means Going Forward
The only way individual residents can truly keep their electric bills as stable as possible is to watch their consumption, especially in periods of extreme weather events.
Residents in many states can also shop for the best electric supply-rate for their home at anytime, locking in a long-term rate is even better because competitive offers from suppliers will be harder to find during extreme weather events due to the rise in wholesale energy costs.
